HTTP 200 Doesn't Mean Your Application Is Working. What Should Monitoring Really Check?
- it sends an HTTP request every few minutes,
- the server responds,
- the monitoring system checks the response status code,
- if it receives
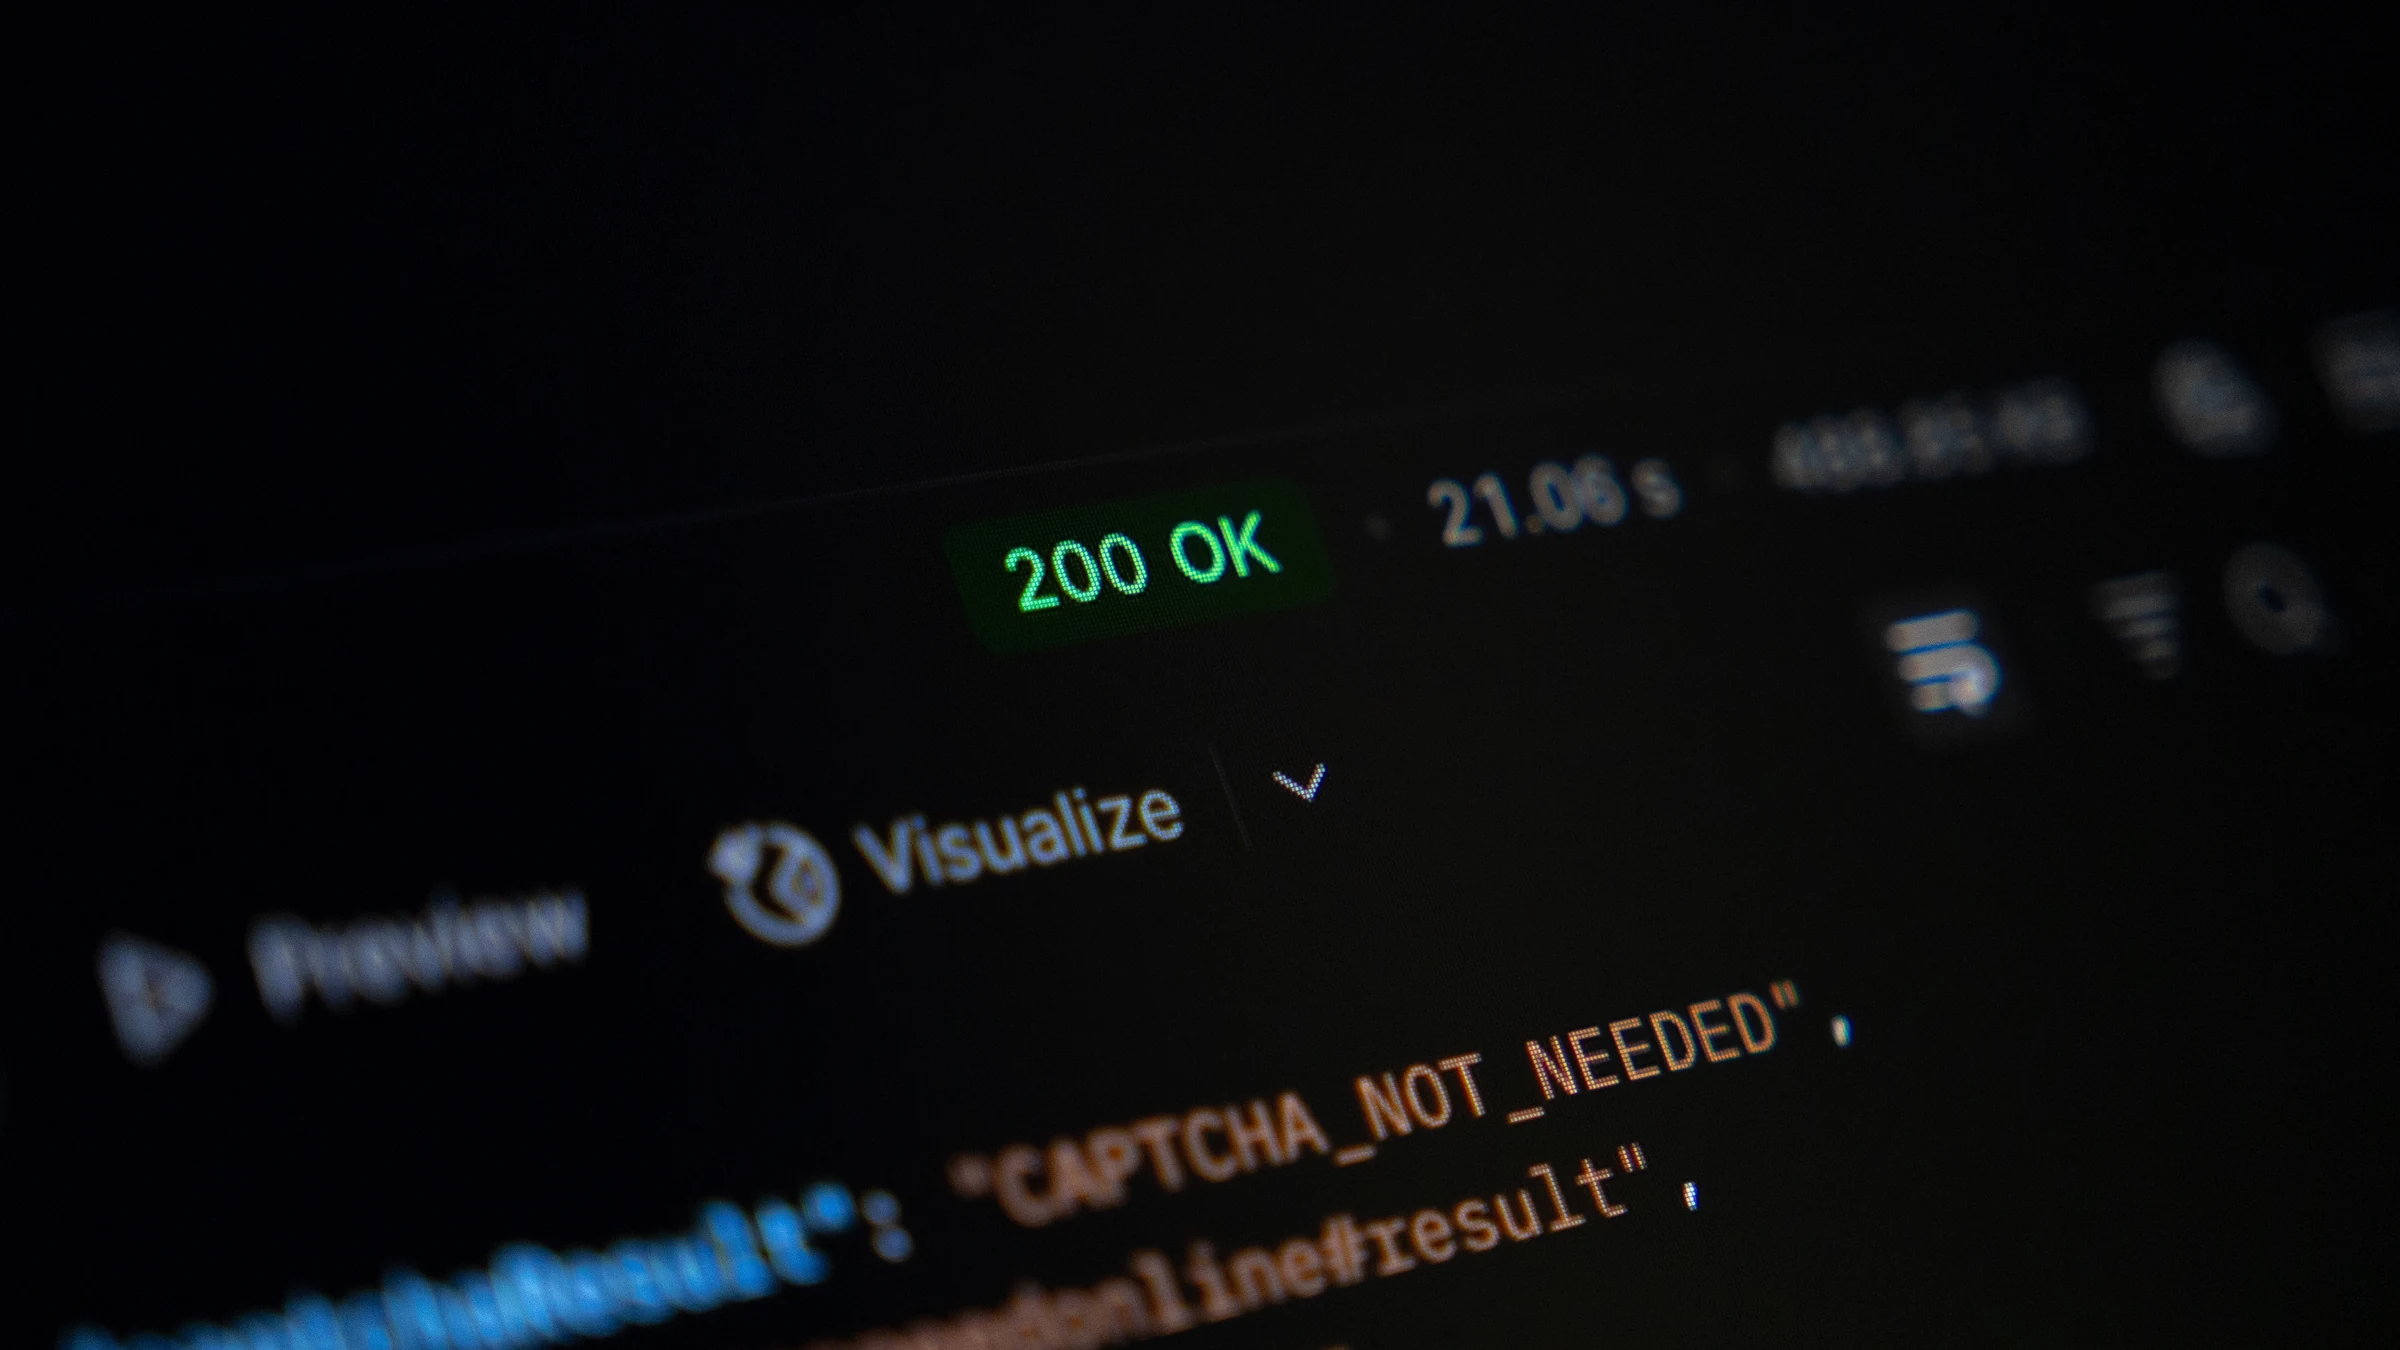
200 OK, it considers the website operational.
The problem is:
HTTP 200 only means that the server returned an HTTP response with a 200 status code. It does not mean that the application is actually working correctly.
An online store can return 200 OK even when customers cannot add products to the cart.
A customer dashboard may load correctly, while the login process fails.
A website may open, while its API takes 15 seconds to respond.
The checkout may be displayed correctly, while every payment attempt ends with an error.
A monitoring system that only shows a green "UP" status may consider everything operational in each of these cases.
Uptime and Correct Application Behavior Are Two Different Things
Let's assume we are monitoring:
https://example.comThe system sends the following request:
GET /The server responds:
HTTP/1.1 200 OKFrom the perspective of a simple uptime monitor, everything is fine.
But users do not interact with a website by checking its HTTP status code.
Users:
- open pages,
- click,
- search,
- sign in,
- submit forms,
- add products to the cart,
- make payments,
- use APIs.
That's why the question:
"Is the server responding?"
is only the first level of monitoring.
A much more important question is:
"Can users actually do what they came to the website to do?"
Case 1: The Website Returns 200 but Displays an Error Message
Imagine an application experiencing a database problem.
The backend catches the exception and renders a custom error page instead of returning HTTP 500.
The response may look like this:
HTTP/1.1 200 OK
Content-Type: text/html
while its content is:
<h1>Something went wrong</h1>
<p>Please try again later.</p>
For the user, the application is not working.
For a simple monitor:
200 OKwhich means everything is fine.
That's why good HTTP monitoring should not be limited to checking the response status alone.
In some cases, it is also worth checking the response content.
For example, you can verify that the page contains a specific element or text that indicates the application loaded correctly.
Case 2: The Homepage Works, but the Checkout Doesn't
This is one of the most important issues in online store monitoring.
The monitor checks:
GET /and receives:
200 OKMeanwhile:
/cartworks, but:
/checkoutreturns an error.
Or even worse, the checkout also returns 200, but the JavaScript responsible for selecting a payment method has stopped working.
From an infrastructure perspective, the store is available.
From a business perspective, the store may be practically unavailable.
If customers cannot pay, the fact that the homepage is working has little value.
That's why monitoring should cover the most important business-critical paths, not just the homepage.
For an online store, these may include:
- the homepage,
- product pages,
- search,
- the shopping cart,
- checkout,
- payment endpoints,
- APIs responsible for inventory levels.
For a SaaS application:
- sign-in,
- registration,
- the dashboard,
- the application's most important feature,
- the API,
- queues or scheduled tasks.
Case 3: The Application Works, but It's So Slow That It's Practically Unusable
Another problem appears when the response looks like this:
HTTP 200
Response time: 12.8 s
Is the application working?
Technically, yes.
Will the user consider it to be working correctly?
Not necessarily.
Monitoring should therefore analyze not only availability but also response time.
At the same time, it is important not to overreact to individual spikes.
If the typical response time is 300 ms and one request takes 900 ms, that does not necessarily indicate an outage.
But if response times over the last 20 minutes increase like this:
300 ms → 450 ms → 800 ms → 1.4 s → 2.8 sthat is a much more interesting signal.
The application is still working, but its health is clearly deteriorating.
This is often the best time to react - before a complete outage occurs.
Case 4: The Frontend Works, but the API Doesn't
Modern applications often consist of multiple independent components.
For example:
Frontend
   ↓
API
   ↓
Database
   ↓
Redis
   ↓
Queue
   ↓
External services
Simply opening the frontend may not involve all of these dependencies.
A Next.js application may render a page correctly while the backend API is returning errors.
Similarly, an administration panel may open normally even though the queue has stopped processing jobs.
That's why monitoring only the public URL does not provide a complete picture of the application's health.
Case 5: Errors Affect Only Some Users
Partial outages are even more difficult to detect.
For example, a problem may occur only:
- on mobile devices,
- in a specific browser,
- for users from a specific country,
- after signing in,
- with a specific payment method,
- for a single API endpoint.
From the perspective of a standard uptime monitor, the application may appear completely healthy the entire time.
This shows why external monitoring should be combined with error monitoring inside the application.
Uptime and Error Monitoring Answer Different Questions
Uptime monitoring primarily answers the question:
"Can the service be reached from the outside?"
Error monitoring answers a different question:
"Are errors occurring while the application is running?"
These are two different perspectives.
Let's assume the application handled:
100,000 requestswithin one hour, and 2% of them ended with an application error.
That means:
2,000 failed requestsAt the same time, the homepage may have returned:
200 OKevery time the uptime monitor checked it.
Uptime:
100%But that does not mean the application was running without problems.
Monitoring Should Work in Layers
Instead of trying to answer "Is everything working?" with a single metric, it is better to monitor several independent layers.
Layer 1: Availability
Is the server responding?
Among other things, we check:
- HTTP status codes,
- timeouts,
- DNS issues,
- connection issues,
- redirects.
Layer 2: Response Time
How quickly does the application respond?
We are interested not only in the current value but also in how it changes over time.
A sudden drop in performance may be the first sign of a problem.
Layer 3: SSL Certificate
Is the certificate:
- valid,
- not expired,
- not going to expire within the next few days?
An SSL outage is particularly unnecessary because it can usually be detected long before it becomes a problem.
Layer 4: Response Content
Did the server return what we expected?
A 200 status code alone may not be enough.
Layer 5: Application Errors
Is the backend generating exceptions?
It is worth monitoring:
- the error type,
- the stack trace,
- the endpoint,
- the environment,
- the application version,
- the first and most recent occurrence,
- the frequency of occurrence.
Layer 6: Website Performance
An application may respond quickly at the HTTP level while still performing poorly in the browser.
That's why it is also worth monitoring frontend performance and Core Web Vitals.
Layer 7: Business Process
The highest level of monitoring answers the question:
"Can the user actually complete the most important action?"
For an online store, that means completing a purchase.
For a SaaS application, it may mean signing in and performing the main operation.
For a lead generation website, it means submitting a form.
The Most Dangerous Failures Don't Always Mean Complete Downtime
Paradoxically, a complete outage is easy to detect.
If the server stops responding and starts returning:
502 Bad Gatewaymonitoring will quickly detect the problem.
Much more difficult to detect are failures where:
the website is up, but something important has stopped working.
These are exactly the kinds of problems that can remain unnoticed for many hours.
The store is online but cannot accept orders.
The form looks like it works but does not send messages.
The application is online, but some users cannot sign in.
The API is available, but one critical endpoint is returning errors.
That's why effective monitoring should not reduce the entire state of an application to a single green or red indicator.
So What Does "The Application Is Working" Actually Mean?
There is no single universal answer.
A well-monitored application should be observed from several perspectives at the same time:
- is it responding,
- is it responding quickly enough,
- is it returning the correct content,
- is it generating an unusual number of errors,
- is its SSL certificate valid,
- is the frontend performing well,
- are the most important business functions available.
Only by combining this information can you get a realistic picture of your application's health.
HTTP 200 is an important signal. But it is only one of them.